



Most flower shops don't fail because they can't sell flowers. They fail because the money moves in ways the owner never fully sees. Cash comes in lumpy — a wedding here, a Mother's Day surge there — while cash goes out steadily and unpredictably: rent, payroll, and a wholesale invoice that's 15% higher than last month because your grower had a bad freeze.
The three forces that quietly wreck florist cashflow are shrink, seasonality, and supplier volatility. They're usually treated as separate problems. They aren't. They feed each other, and the standard P&L most florists run hides all three at once. Your accountant hands you a clean income statement, everything looks fine on paper, and yet your checking account keeps dipping to a scary number by the third week of every month.
This is a playbook for building a florist cashflow system that actually reflects how perishable, seasonal, supplier-dependent businesses work — with line items that show shrink honestly, a liquidity plan built around your real calendar, and templates you can copy this week.
Why the standard P&L lies to florists
A generic profit-and-loss statement assumes your inventory converts to revenue in a fairly predictable way. Buy stock, sell stock, book the margin. For a hardware store, that mostly holds. For a flower shop, it's fiction.
When you buy 300 stems and 70 of them die in the cooler or wilt before they sell, that loss disappears into "cost of goods sold" on a standard P&L. You see a fat COGS number and a thin gross margin, but you can't tell why. Was it pricing? Was it shrink? Was it a bad supplier fill? The number gives you nothing to act on.
Here's a pattern that shows up constantly: an owner looks at 42% gross margin, decides it's "a little low," and raises prices across the board. Sales dip because the roses are now overpriced for the neighborhood — but the actual problem was that hydrangea shrink was running near 30% and dragging the whole average down. They fixed the wrong thing because their financials didn't separate the causes.
A shrink-adjusted P&L breaks that fog. Instead of one blended COGS line, you split cost of goods into what you sold versus what you lost, and you tag the loss by cause. It's a small structural change with a big payoff: you finally see the difference between a margin problem and a waste problem.
The shrink‑adjusted P&L: line items that tell the truth
The goal isn't accounting perfection. It's visibility. You want a monthly statement where a glance tells you whether last month's pain came from pricing, perishability, or your supplier.
Never miss a bloom or a delivery.
Blomsly helps you manage orders, track stock, and schedule deliveries effortlessly.
- Unified order management
- Real-time inventory tracking
- Delivery scheduling & notifications
No credit card required
Here's the core restructure. Take your normal COGS block and expand it:
| Line item | What it captures | Why it matters |
|---|---|---|
| Product cost — sold | Wholesale cost of stems/goods that actually became a sale | Your true cost basis for pricing decisions |
| Shrink — spoilage | Stems that died in-cooler or wilted before sale | Isolates perishability + handling problems |
| Shrink — over-order | Product bought but never used, tossed at end of life | Signals forecasting and PO sizing issues |
| Shrink — damage/prep loss | Broken stems, over-processing, design waste | Signals bench/technique problems |
| Supplier variance | Cost gap between quoted PO and delivered invoice | Exposes supplier volatility in dollars |
| Substitution cost | Extra cost when you upgrade a stem to fill a short order | Hidden margin leak during peak season |
Once "shrink" stops being one blurry number and becomes three or four honest lines, your monthly review changes completely. Spoilage creeping up? That's a cooler, ordering-cadence, or freshness-rotation issue. Over-order shrink spiking every February? Your Valentine's forecast is too aggressive. Supplier variance eating 3–4 points of margin? Time for a hard conversation with your grower.
A worked example makes this concrete. Say a mid-size shop does roughly $38k in revenue in a normal month.
-
Product cost — sold
$12,900
-
Shrink — spoilage
$1,650
-
Shrink — over-order
$780
-
Shrink — damage/prep
$420
-
Supplier variance
$610
-
Substitution cost
$340
Blended together, that's about $16,700 in COGS and a gross margin near 56%. Looks fine. But split out, you can see roughly $3,800 walked out the door as shrink and supplier slippage — close to 10 points of margin. That's not a pricing problem. That's an operations problem hiding inside a pricing-shaped number.
If you want to go deeper on the waste side specifically, the mechanics of recovering that lost margin are worth their own read in the florist waste-reduction playbook. This article is about wiring those numbers into your cash planning, not just your P&L.
Why shrink, seasonality, and supplier volatility compound each other
Treat these three as one system, because that's how they behave on your bank statement.
Seasonality drives you to over-order ahead of peaks. Over-ordering increases spoilage risk. Supplier volatility means the product you do get is inconsistent in quality and price, which forces substitutions and pushes shrink higher still. Then the slow season arrives, revenue drops 30–40%, and you're paying down invoices from a buying spree that didn't fully sell through.
That's the trap. Peaks feel great because revenue is high. But peaks are also where the most cash gets committed — bigger orders, more labor, more spoilage exposure. If your cash planning only tracks revenue, you'll feel rich in May and broke in July and never quite understand why.
A realistic pattern: a shop books its best-ever Mother's Day, does maybe $19k in a single week, and feels flush. But it pre-bought heavy, ran overtime, and ate substitution costs when the supplier shorted the peony order by 40%. Six weeks later, mid-summer is dead, two big wire-service payouts are still in transit, and payroll lands on a week with almost no walk-in traffic. The Mother's Day money is gone — it was spent forward, and the P&L never flagged it because on paper the month was profitable.
Profit and cash are not the same thing. Shrink and seasonality are exactly where they diverge.
Building a seasonal liquidity plan around your real calendar
A liquidity plan is just a forward view of cash — not profit — mapped against the peaks and troughs you already know are coming. Every florist has roughly the same skeleton: Valentine's Day, Mother's Day, prom/graduation, a wedding-heavy stretch, a summer lull, a fall wedding bump, and the December holidays. Your job is to fund the valleys from the peaks instead of hoping the timing works out.
Here's a simple process to build one:
-
Map 13 months of revenue by week, not by month. Monthly views hide the fact that most of Valentine's revenue lands in about five days. You need weekly resolution to see the real cash swings.
-
Overlay committed outflows on the same weekly grid
rent, payroll, loan payments, recurring software, insurance. These don't care what season it is.
-
Layer in variable outflows tied to peaks — the big pre-buys, seasonal hires, extra delivery costs. Place them in the weeks you spend the money, not the weeks you sell.
-
Calculate your weekly net cash position and find your lowest points. For most shops the danger zones are late summer and the dead weeks of January and August.
-
Set a peak-season reserve target. After each peak, sweep a fixed percentage of the surge revenue — often 10–20% — into a separate account earmarked for the next valley. Treat it like a bill you owe your future self.
The reserve target is the piece most owners skip, and it's the one that matters most. Pulling cash out during the good weeks is what keeps the slow weeks from becoming emergencies. Without it, every peak just funds a bigger buying habit and the cycle repeats.
Peaks also carry operational risk that turns into cash risk fast — understaffing, supplier shortfalls, blown fulfillment. The staffing and supplier-contingency side of that is covered in the peak-season operations playbook, and it pairs directly with the liquidity plan here: your cash reserve is only as good as your ability to actually deliver during the surge.
A quick visual of the weekly liquidity-build process:
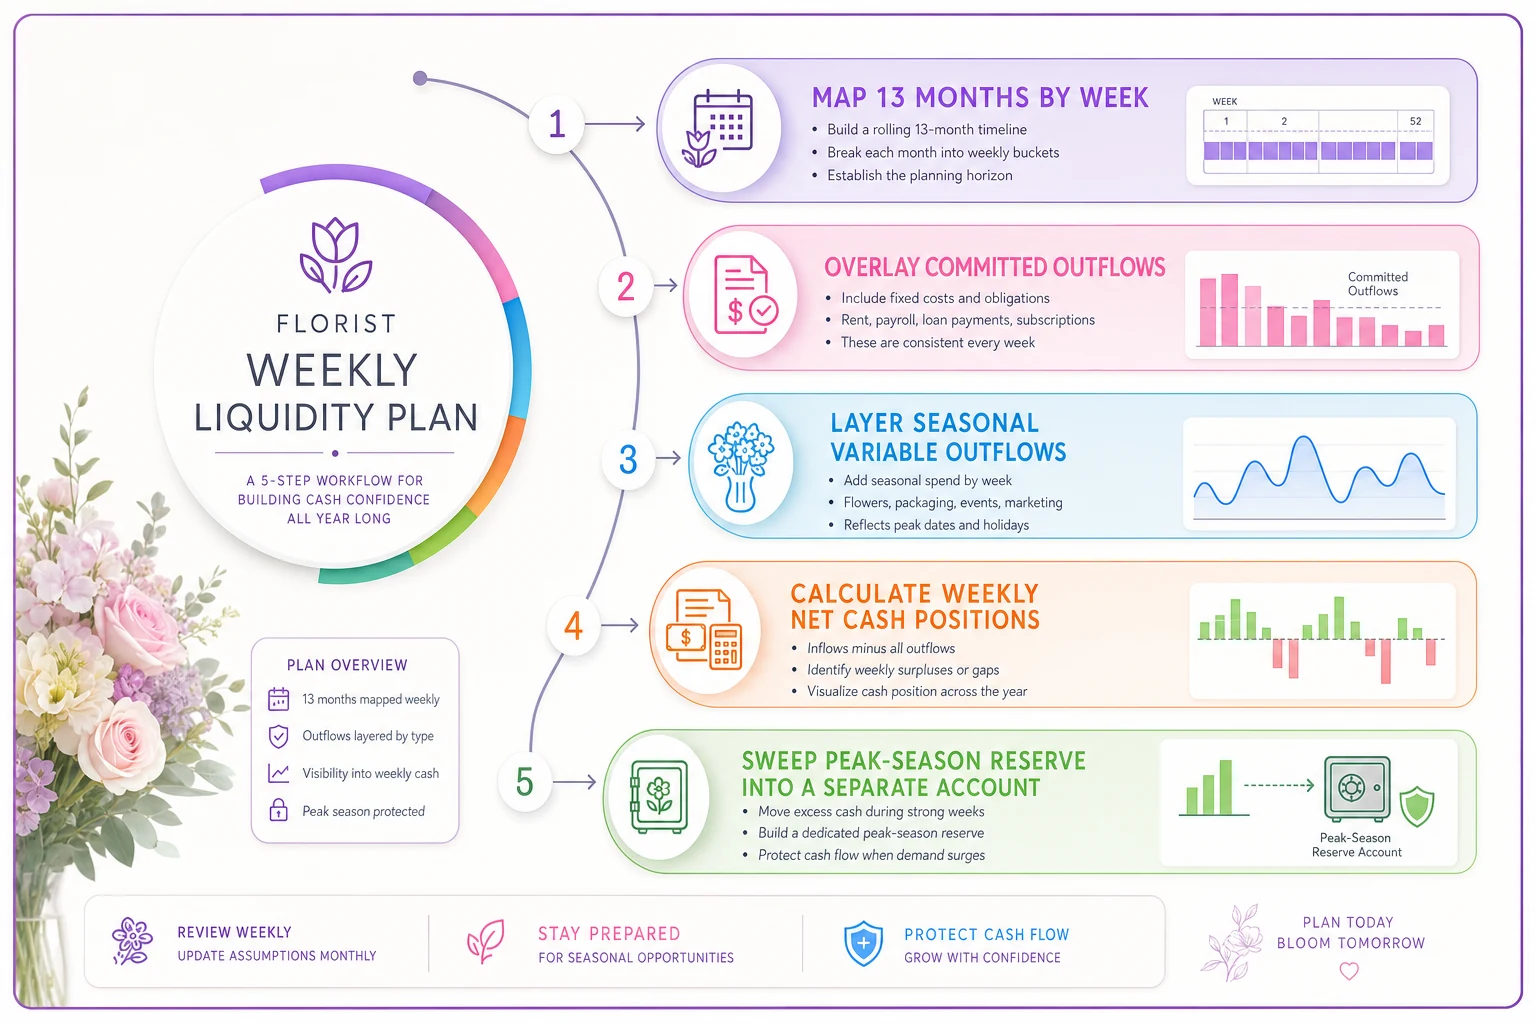
Use this to map your weeks and spot the valleys you'll need to fund from peak-season reserves.
Treat the reserve sweep as an automatic transfer the day after each major peak so it doesn't get spent during the celebration.
The reserve target is the piece most owners skip, and it's the one that matters most. Pulling cash out during the good weeks is what keeps the slow weeks from becoming emergencies. Without it, every peak just funds a bigger buying habit and the cycle repeats.
Pricing that absorbs shrink instead of ignoring it
If your shrink is running 8–12% of product cost — which is common — and your pricing formula doesn't account for it, you're structurally underpricing everything. You're not marking up your cost; you're marking up a fantasy version of your cost where every stem sells.
The fix is to bake a shrink factor into your cost basis before you apply markup. If a stem costs $0.80 and your spoilage rate on that variety runs 15%, your effective cost is closer to $0.94, because you have to sell roughly 85 stems to recover the cost of 100. Price off the effective cost, not the invoice cost.
This gets more useful when you do it by SKU class instead of shop-wide. Hardy greens and carnations with near-zero shrink don't need the same padding as garden roses that turn in three days. Blending them together means your durable products quietly subsidize your fragile ones — which is fine until the mix shifts and margin collapses without warning. The full logic of pricing by SKU with seasonal tiers is covered in the profit-per-SKU pricing guide; the point here is simpler: shrink belongs inside your cost before markup, per category, not as a vague safety cushion layered on top.
-
[ ] Do you know your spoilage rate by SKU class, not just shop-wide?
-
[ ] Is a shrink factor built into your cost before markup?
-
[ ] Do fragile and durable products carry different padding?
-
[ ] Do your prices shift with seasonal wholesale cost swings, or are they static all year?
-
[ ] When a supplier invoice comes in higher than quoted, does that variance ever reach your retail price — or do you just eat it?
That last one catches almost everyone. Supplier variance gets absorbed silently far more often than it gets passed on.
Taming supplier volatility on the cash side
You can't control whether your grower gets hit by weather. You can control how exposed your cash is when they do. Supplier volatility hurts in three ways: price swings, fill-rate misses, and quality inconsistency that forces upgrades or increases prep waste.
The cash defense is diversification and measurement. Splitting a category across two suppliers costs a little in volume pricing but buys real stability in fill rates during peaks — and fill-rate misses during Valentine's or Mother's Day are pure margin destruction, because that's when substitution costs spike hardest.
Track supplier variance as its own line, as shown earlier. Once you can say "Supplier A cost us $2,100 in variance and short-fills last quarter," you have leverage, and you have data to decide whether their low quoted price is actually low. A cheap supplier who fills 82% of your peak orders is often more expensive than a pricier one who fills 97%, once you count the substitution costs and lost sales.
When this level of financial detail actually makes sense
Be honest about where you are. If you're a one-person shop doing under around $150k a year with simple product lines, a full shrink-adjusted P&L with six COGS sub-lines might be more machinery than you need right now. Start with just two: sold vs. shrink. That single split alone will tell you most of what you're missing.
The full system earns its keep once you're running multiple channels, carrying real wholesale exposure, hiring seasonal staff, or feeling that gap between "profitable on paper" and "scared of the bank balance." That's the signal you've outgrown a simple P&L.
Who should NOT overbuild this
If you're a hobby-scale shop or you sell mostly pre-made, low-perishability arrangements with predictable weekly volume, don't drown yourself in tracking. The overhead of measuring can exceed the money you'd recover. Build tracking for the problems that are actually costing you money, and ignore the rest until they start to matter.
A short real scenario
A two-location neighborhood florist doing roughly $34k–$40k a month kept ending up short on cash in late July and mid-January despite a "profitable" year on the books. When they finally split their COGS the way described above, two things jumped out: spoilage on premium stems was running near 22%, and supplier variance was quietly adding 3–4 points to cost during peaks because their primary grower kept short-filling and forcing upgrades.
They made three changes. Rebuilt pricing off shrink-adjusted cost by SKU class. Split their rose and hydrangea buys across a second supplier. Started sweeping about 12% of Valentine's and Mother's Day revenue into a reserve account the day after each peak.
Nothing dramatic happened overnight. But over the following two seasons, the July and January cash crunches stopped being emergencies. Shrink on premium stems settled closer to 13–14%. And for the first time, the owner could look at the weekly cash grid in April and have a reasonable sense of how summer would feel — instead of finding out the hard way.
Where software quietly earns its place
You can run all of this in spreadsheets, and plenty of shops do for years. The friction shows up in the data collection, not the math. Splitting COGS by cause means someone has to record what died and why. Tracking supplier variance means matching every delivery against the original PO. Building a weekly liquidity view means pulling sales from your POS, your website, and your wire service into one place.
This is where an operational platform that already tracks your inventory lifecycle, purchase orders, and sales channels removes the need to be the human glue between five disconnected tools. When the system knows what you ordered, what arrived, what sold, and what got tossed, the shrink-adjusted P&L and the liquidity view come together on their own instead of eating your Sunday nights. The point isn't automation for its own sake — it's making sure the numbers you're making decisions on are actually complete and current, so the whole playbook above runs on real data instead of gut feel.
Pulling it together
Financial resilience for a flower shop isn't about squeezing another two points out of a bouquet. It's about seeing your money the way it actually moves — lumpy, seasonal, and constantly shaved by shrink and supplier surprises — and building a system that funds the valleys from the peaks on purpose.
Start small. Split COGS into sold vs. shrink this month. Build a 13-week forward cash view and find your lowest points. Set one reserve target and actually move the money after your next peak. Those three moves alone will tell you more about your business than a year of clean-looking P&Ls ever will — and they'll turn the cashflow anxiety most florists just live with into something you can see coming and plan around.
Ready to grow your flower shop business?
Join 500+ flower shops using Blomsly to save time, reduce errors, and delight customers with fresh blooms.