



Most florists manage assortment by feel. You notice the peony buckets moving fast in May, the dried arrangements collecting dust since February, and you adjust the next order based on gut. That works when you're small and touching every stem yourself. It stops working the moment someone else is doing the ordering, or when you're carrying enough SKUs that "gut" just becomes a guess.
The real issue isn't that florists make bad assortment calls. It's that they make them once and never build a repeatable way to check whether the call was right. A product gets added, lives in the cooler for a season, and nobody ever formally decides whether it earned its spot. The shelf fills up with legacy SKUs that felt like a good idea in 2022.
What follows is a quarterly experimentation loop — a structured way to test assortment decisions with small samples, measure how price-sensitive each product actually is, and feed the results into rules that make the next round of decisions faster. The point isn't more spreadsheets. It's turning assortment from a vibe into a system you can run in a couple hours per quarter.
Why gut-feel assortment breaks down
The core problem with eyeballing assortment is that two very different products look identical on a sales report. A $65 bouquet and a $9 ribbon upsell can both show "sold 40 units this month," but the economics behind them are nothing alike, and the decisions they demand are opposite.
Stems and arrangements are perishable, labor-heavy, and margin-variable. Accessories — vases, ribbon, cards, chocolates, candles, preserved items — are shelf-stable, low-labor, and usually higher margin per dollar of cost, but they move slower and tie up different kinds of risk. When you lump them together on one report, your best accessories get judged by stem-velocity standards and quietly killed, while your worst stems hide behind strong revenue numbers that mask their waste cost.
The pattern that shows up across small shops: the products people think are winners are usually the loud ones — high revenue, high visibility. The actual profit drivers are often quiet SKUs doing boring, steady, low-waste work. Without a measurement loop, you keep feeding the loud ones and starving the quiet ones.
The worked economics: stems vs accessories
Before you can test anything, you need to be honest about what each SKU actually earns after real costs. For florists, the big hidden cost is almost always shrink on the stem side and slow turns on the accessory side.
Never miss a bloom or a delivery.
Blomsly helps you manage orders, track stock, and schedule deliveries effortlessly.
- Unified order management
- Real-time inventory tracking
- Delivery scheduling & notifications
No credit card required
A stem-based SKU (a signature mixed bouquet)
-
Retail price
$58
-
Stem + greens cost
$19
-
Design labor
~12 minutes at a loaded rate of about $26/hr = $5.20
-
Packaging/wrap
$2.10
-
Expected shrink allocation (you build roughly 20 of these a week, lose about 3 to unsold/damaged stems): if 3 of 20 buckets' worth of ingredients get tossed, that's ~15% waste load on cost, call it $2.85 added per sold unit
Contribution per unit: 58 − 19 − 5.20 − 2.10 − 2.85 = $28.85, roughly a 50% contribution margin — but shrink is eating almost 10% of that.
An accessory SKU (a ceramic bud vase sold as an add-on)
-
Retail price
$22
-
Unit cost
$7.50
-
Labor to stock/sell
negligible, call it $0.40
-
Shrink
near zero (maybe the occasional chip), call it $0.15
Contribution per unit: 22 − 7.50 − 0.40 − 0.15 = $13.95, about a 63% contribution margin.
The vase makes less per unit in absolute dollars but keeps far more of its price, carries almost no spoilage risk, and doesn't fight for your designer's time during a Friday rush. The lesson isn't "sell more vases." It's that these two SKUs need different thresholds to be judged fairly. Holding them to the same revenue-per-facing rule is how good accessories get pruned and waste-heavy stems get protected.
If you want the deeper per-SKU profit framework underneath this, it's worth reading what a florist pricing strategy really needs, which lays out the profit-per-SKU matrix this loop builds on.
Measuring elasticity when you have low traffic
The honest challenge for most flower shops: you don't have the volume for clean statistical testing. A shop doing 60–120 transactions a week can't run a proper A/B test and expect tidy results. So you do the next best thing — small, deliberate price and promotion probes, repeated, and read as directional signals rather than proof.
Elasticity, in plain terms: when I change the price, how much does quantity move? You don't need a formula fetish. You need a rough read on whether a product is price-sensitive (cutting price lifts units enough to earn more total profit) or price-insensitive (people buy it regardless, so discounting just donates margin).
A low-traffic way to probe it:
-
Pick a single SKU and a single channel (in-store or the website — not both at once).
-
Run the normal price for two weeks and log units sold.
-
Change price by a meaningful amount — 10–15%, not 3% — for the next two weeks.
-
Compare units and, more importantly, total contribution dollars, not unit count.
A worked example. Your signature bouquet at $58 sells about 20/week, contribution ~$28.85, so weekly contribution ≈ $577. You test it at $51 (a ~12% cut). Units climb to 27/week. New contribution per unit ≈ $21.85. Weekly contribution ≈ $590. Basically flat — meaning that bouquet is mildly elastic but discounting barely moves total profit. Good to know: don't bother discounting it, protect the price.
Now contrast an accessory probe. The $22 bud vase sells 6/week. You bundle it at $16 with any bouquet. Units jump to 18/week. Per-unit contribution drops to ~$7.95 but weekly contribution goes from ~$84 to ~$143. That's a product worth promoting as an attachment — it's elastic and the volume lift pays.
Two things to watch so you don't fool yourself:
-
Seasonality contamination. Don't run your probe across Mother's Day week and compare it to a dead week. Pick comparable weeks or repeat the test in a later quarter.
-
Channel bleed. If you promote something in-store, don't be surprised when web numbers shift too. Keep the test contained. The channel-cap approach for localized offers is useful here for keeping a promo from leaking into channels you didn't mean to test.
A low-traffic approach accepts noise and looks for direction, not statistical purity.
The promote / park / retire decision rules
Once you have a rough read on economics and elasticity, every SKU needs a verdict each quarter. Three buckets, with concrete thresholds you can adjust to your shop:
Promote — give it more facings, feature it on the site, train staff to suggest it:
-
Contribution margin above ~45%
-
Sell-through above ~70% of what you stock, with low waste
-
Shows elastic response (promotion lifts total contribution, not just units)
Park — keep it, but don't invest more in it; revisit next quarter:
-
Contribution margin 30–45%, or steady sales but flat response to any price move
-
Sell-through 40–70%
-
Fills a real occasion gap even if numbers are mediocre (sympathy work, a price-point anchor)
Retire — stop reordering, clear remaining stock:
-
Contribution margin below ~25% after real shrink is loaded in
-
Sell-through under ~35% two quarters running
-
No strategic role (not an anchor, not a gap-filler, not a reliable attachment)
When parking a SKU, add a calendar reminder with the exit date so it doesn't linger.
The mistake most owners make here is letting "I like it" or "a regular asked for it once" keep a SKU in the Park bucket indefinitely. Park should be a holding pen with an exit date, not a retirement home. If something has been parked three quarters straight with no improvement, it's a retire — you're just avoiding the decision.
The seasonal pruning matrix
Seasonal SKUs deserve their own grid because "it only sells in December" isn't a flaw — it's the whole point. Judge seasonal items against their season, not the calendar year.
| Season sell-through | Contribution margin | Shrink / dead stock | Verdict |
|---|---|---|---|
| High (>70%) | High (>45%) | Low | Expand — order deeper next season, add variants |
| High (>70%) | Low (<30%) | Low | Reprice — it moves, so test a higher price before expanding |
| Medium (40–70%) | Medium | Medium | Hold flat — same order quantity, don't grow it |
| Low (<40%) | Any | High | Retire from the seasonal set |
| Low (<40%) | High | Low | Keep as a niche anchor — small quantity, premium framing |
A concrete read: say your preserved-rose domes sold through at 58% last Valentine's season at a 52% margin with almost no leftover stock. That's a "hold flat" — don't get greedy and double the order, because 58% sell-through means doubling likely drops you into waste territory. Meanwhile your foil-wrapped poinsettia pots hit 82% sell-through but only 24% margin after the breakage you always eat. That's a "reprice" candidate before it's anything else — it clearly has demand you're underpricing.
For the fuller retirement methodology behind this grid, the assortment-pruning framework for retiring low-performing SKUs goes deeper on the mechanics of cleanly removing a product without stranding inventory.
Running the quarterly loop end to end
Here's how the whole thing fits together as a repeatable cycle, not a one-off cleanup:
-
Hypothesis (week 1). Write down 2–4 specific bets. "I think the $16 bundle vase will attach at 2x current rate." "I think the large sympathy arrangement is underpriced." Specific and testable, not "sell more add-ons."
-
Small-sample promo (weeks 2–5). Run one or two contained probes using the price-change method above. One SKU, one channel, meaningful price move.
-
Elasticity read (week 6). Compare total contribution dollars before and after. Note direction and rough magnitude. You're not publishing a paper — you're deciding whether to double down.
-
Rule updates (week 7). Run every tested SKU through promote/park/retire and the seasonal matrix. Update reorder quantities, website features, and your staff's suggested add-ons.
-
Document and carry forward. Write the verdict next to each SKU so next quarter you're not re-litigating the same question from zero.
The whole loop is maybe six to eight hours of actual work spread across a quarter. The reason it rarely gets done isn't time — it's that results live in someone's head instead of a shared record, so the next quarter starts from scratch.
A quick checklist to keep the loop honest
-
[ ] Shrink is loaded into every stem SKU's margin, not ignored
-
[ ] Stems and accessories are judged by different thresholds
-
[ ] Each probe changes price by at least 10%
-
[ ] You compared contribution dollars, not just unit counts
-
[ ] Every parked SKU has an exit date
-
[ ] Seasonal items are judged against their season, not the full year
-
[ ] Verdicts are written down where whoever orders next can see them
A simple visual can help keep the team aligned.
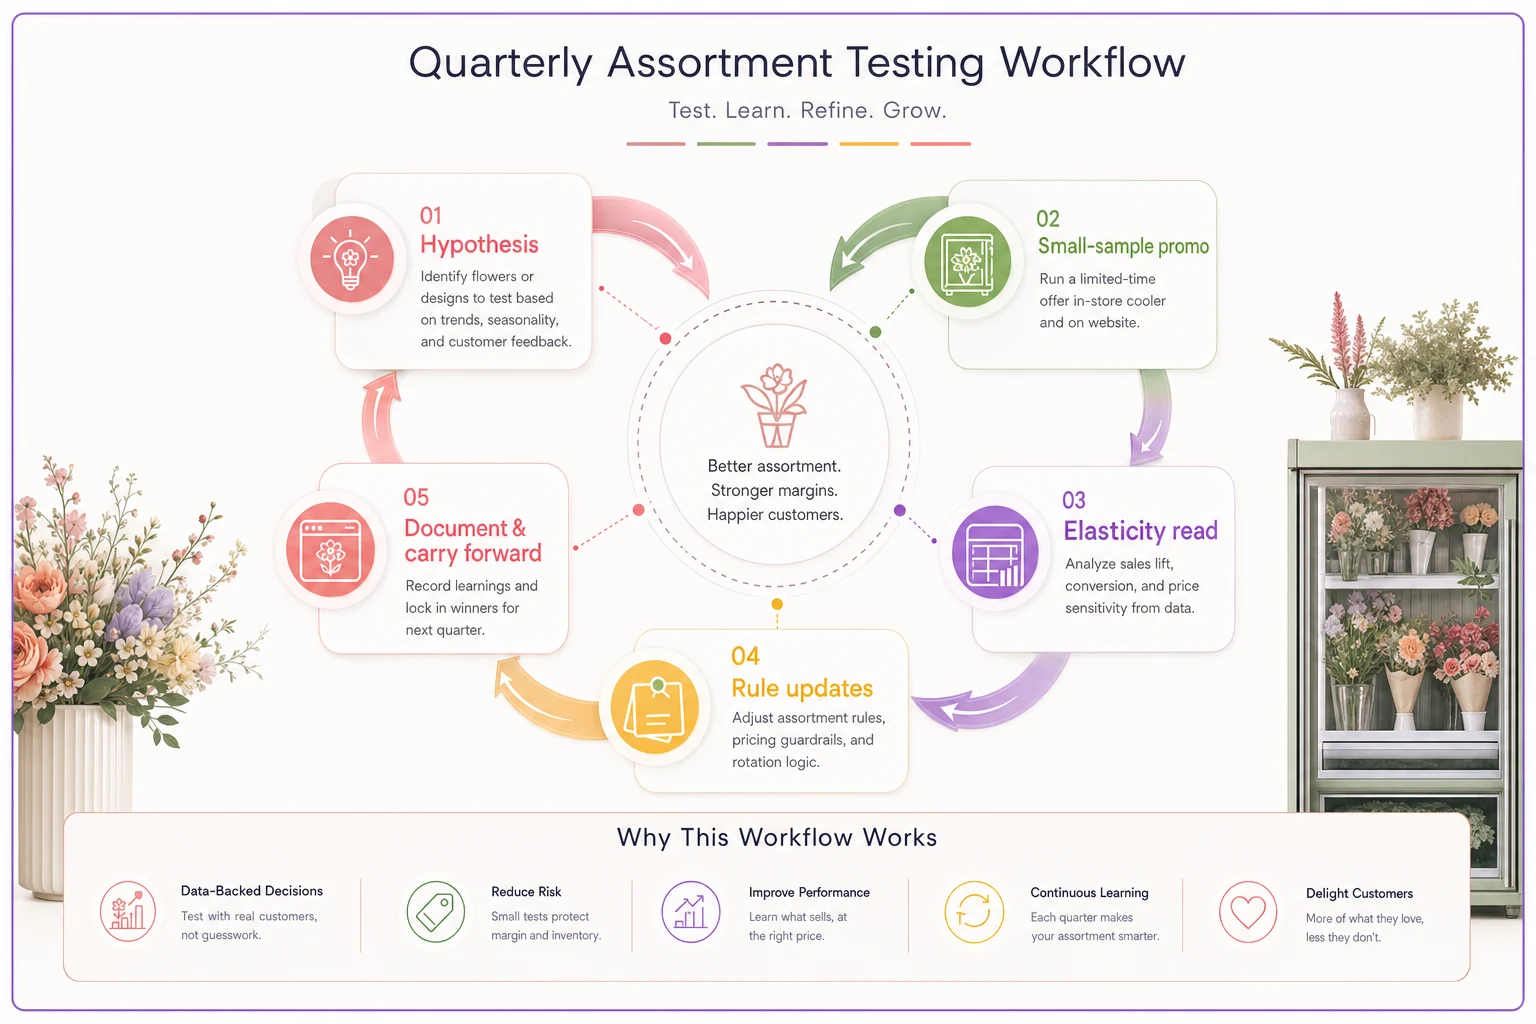
Keep the loop's outputs written where the next person who orders can see them.
A real scenario
A two-designer shop doing roughly $38k–$42k a month in sales was carrying about 70 active SKUs with no real sense of which were actually profitable. The owner suspected her large arrangements were the engine. They weren't — they were loud, not profitable, once shrink got counted honestly.
Over one quarter she ran four probes: two on bouquets, two on accessory bundles. The bouquet price tests came back nearly flat on contribution, confirming she shouldn't be discounting them. One accessory bundle — a candle-plus-bouquet pairing — nearly tripled attachment rate and added around $400–$500 a month in contribution on its own. Running her full list through promote/park/retire, she retired 11 SKUs that were quietly bleeding shrink and margin, and promoted six quiet winners.
Net effect after the next full quarter: roughly the same top-line revenue, but margin improved by a few points and cooler waste dropped noticeably because she stopped stocking low-sell-through stem SKUs. Nothing dramatic on the surface. The real win was that she finally knew why each product was on the shelf.
When this loop makes sense — and when it doesn't
When it's worth doing: You're carrying more than ~30 active SKUs, more than one person makes ordering decisions, or you've noticed waste creeping up without a clear cause. The loop pays for itself fastest in shops that have grown past the point where one person can hold the whole assortment in their head.
When it's overkill: If you're a one-person operation running 15 tightly-controlled SKUs and you already feel your numbers, the formal loop adds overhead you don't need. Keep the mindset — judge accessories differently, load shrink into margin — but skip the quarterly ceremony until complexity grows.
Who should not start here: If your underlying cost data is a mess — you don't know your true stem cost or your actual waste rate — fix that first. Elasticity probes on top of bad cost data just produce confident wrong answers. Get your per-SKU economics clean, then start testing.
The point of all this
Assortment strategy for florists isn't a once-a-year purge of dead products. It's a small, boring, repeatable loop: make a bet, test it cheaply, read what actually happened to your profit, update your rules. The shops that do this stop relitigating the same debates every season and start compounding better decisions — because last quarter's verdict is written down and feeding this quarter's bets.
The spreadsheet-and-cooler-notes version works fine when you're small. As your SKU count and your team grow, the hard part stops being the math and starts being keeping everything in one place — sales, shrink, and contribution tied to each SKU so the loop runs on real numbers instead of memory. Whether that lives in a shared sheet or a proper operational system matters less than whether it exists. The loop only compounds if the results don't evaporate the moment the quarter ends.
Ready to grow your flower shop business?
Join 500+ flower shops using Blomsly to save time, reduce errors, and delight customers with fresh blooms.